Nodal
Brand and data design for smart logistics. Complexity, made readable.
Data visualization
Editorial design
Motion graphics
YEAR
2026
INDUSTRY
Smart logistics, ESG reporting, Eco transport
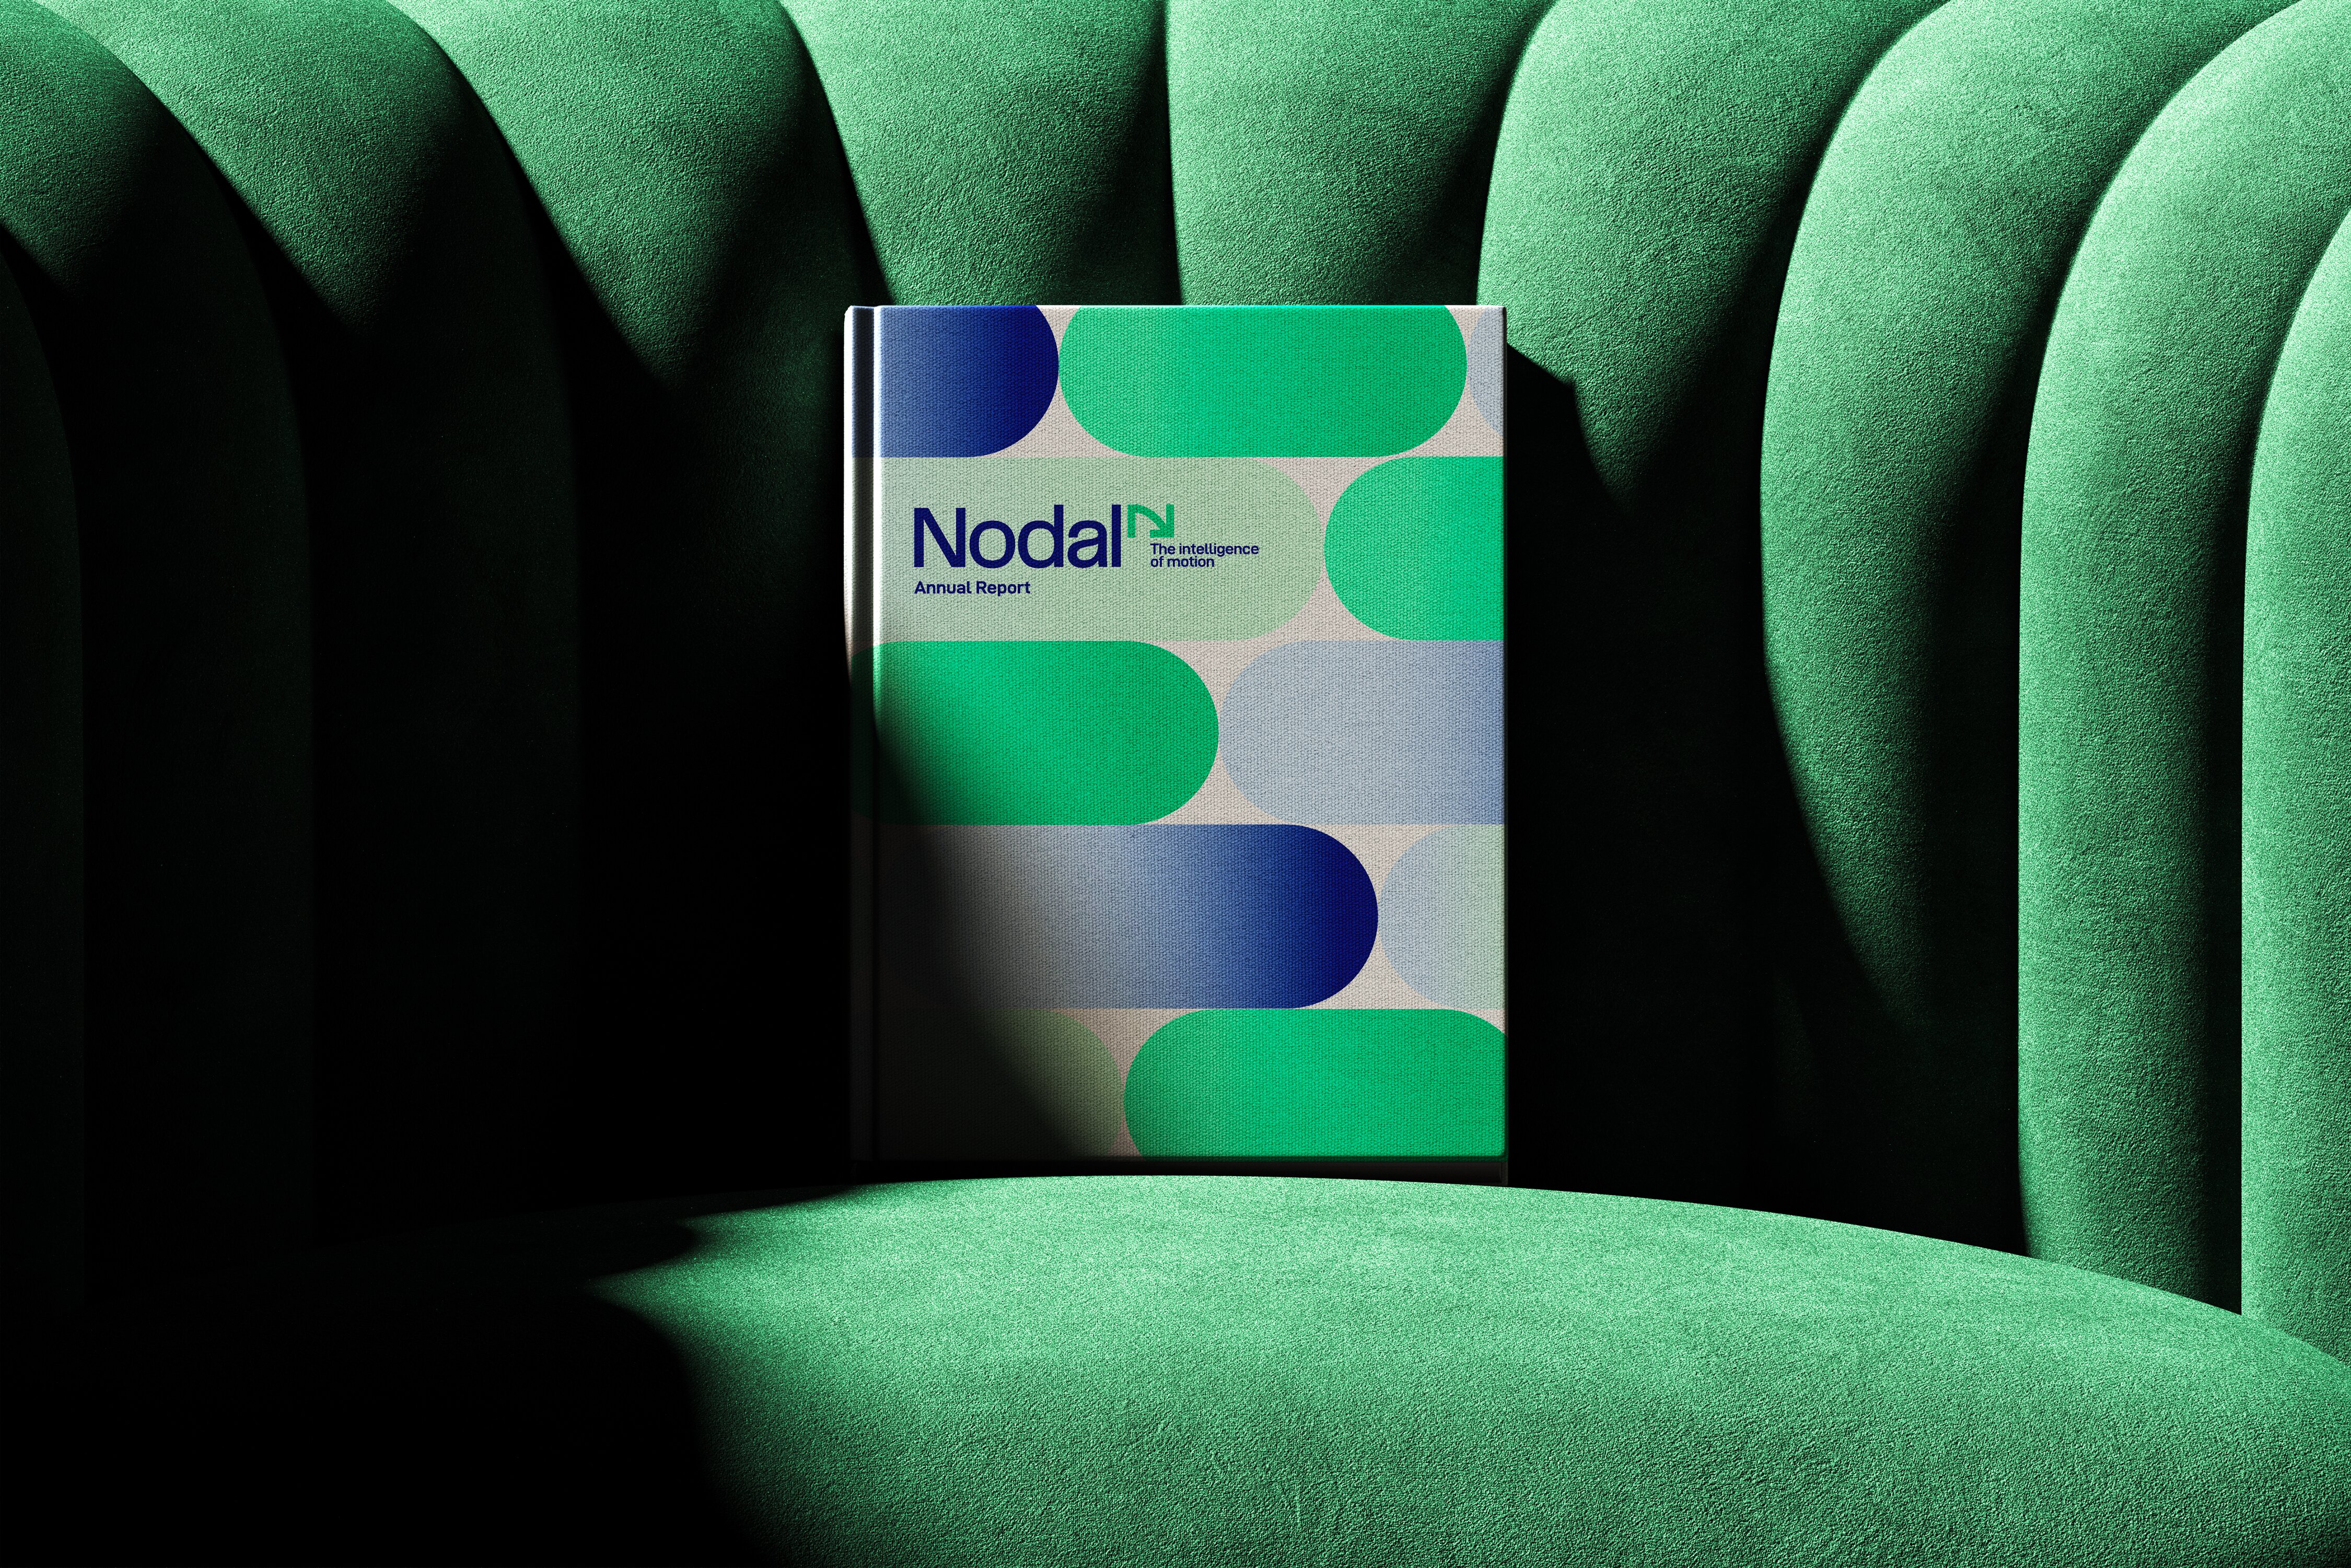
From brute force to smart flow
For decades, logistics ran on brute force: more vehicles, more routes, more volume, with the impact data buried in hundred-page PDFs. Nodal flips that. It uses AI to optimize flows in real time and reads the whole network as one connected system, where cutting emissions and cutting waste turn out to be the same move.

Data as editorial narrative
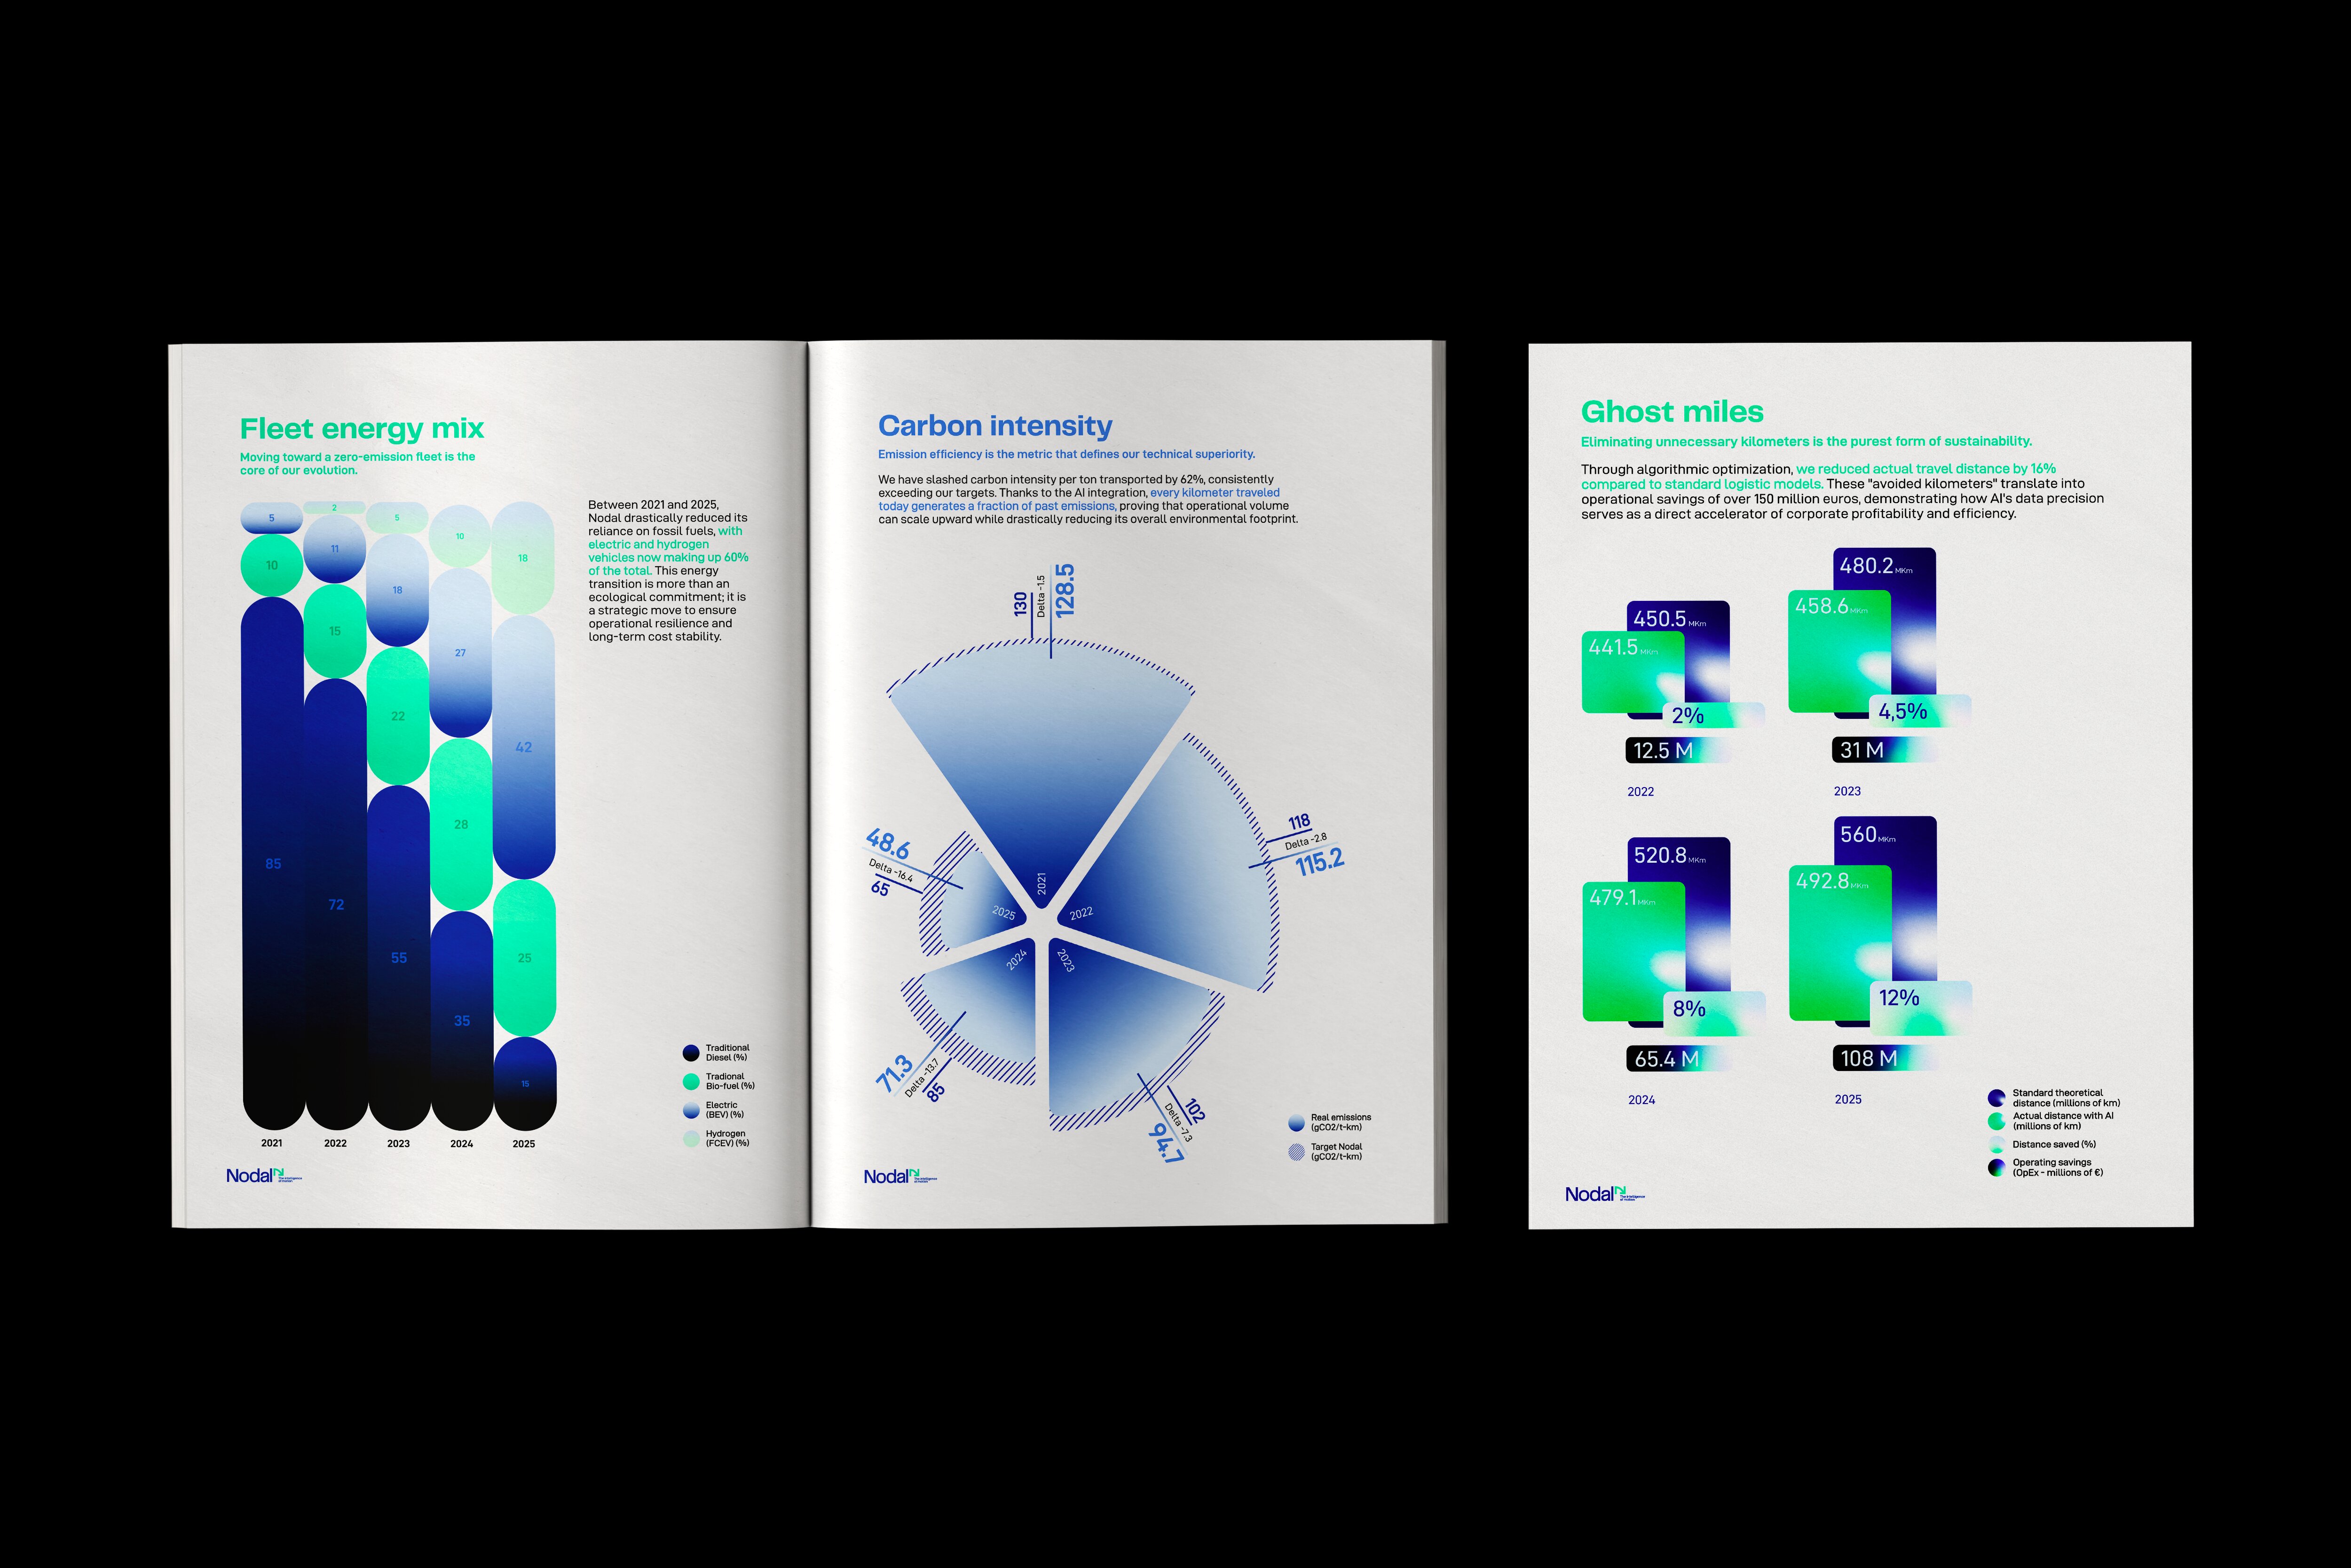
It all lands in a printed annual report, where investors actually follow what the company is doing. Technical infographics and data visualizations unpack the operations: decarbonization results, route efficiency, containers filled instead of half-empty. Complex metrics turned into something you grasp at a glance. Less a document to file, more one people read to the end.
Connect, optimize and protect
Nodal works on three moves. Connect: link land and sea transitions so nothing sits idle. Optimize: no container travels empty, no route runs for nothing. Protect: cross fragile ecosystems with the lightest footprint possible. Where the sector sees chaos, Nodal reads a structure waiting to be tuned.
